
Water costs in the United States have risen steadily over the past decade, and for most households, the monthly bill arrives without much context. There is no standard breakdown explaining what drives the total, how it compares to similar homes, or whether the amount reflects actual consumption or something else entirely. For homeowners managing a budget, landlords overseeing multiple properties, or property managers trying to benchmark operating costs, that absence of context creates a genuine problem.
In 2025, the average American water bill is not a single figure. It varies significantly by household size, geographic region, local utility pricing structures, and seasonal usage patterns. What gets reported as a national average often reflects a midpoint that applies to very few households in practice. Understanding what the data actually shows — and what shapes it — gives households and property owners a more accurate baseline for evaluating their own costs.
What a Water Bill Calculator Reveals About Household Spending
Most water bills present a final charge without showing how each component was calculated. Utilities typically apply a tiered pricing structure, where the cost per gallon increases as consumption rises above a baseline threshold. On top of that, fixed service fees, infrastructure charges, and in some regions, stormwater or wastewater surcharges are added regardless of how much water was actually used. The result is a bill that can look straightforward on the surface but is built from several distinct layers of cost.
A structured Water Bill Calculator guide can help break down these components in a way that a utility statement rarely does. It allows a household to separate fixed costs from variable ones, understand what consumption tier they fall into, and see how small changes in daily use translate to monthly dollar differences. This kind of visibility is particularly useful for households that have recently changed in size, moved to a new region, or added water-intensive appliances.
Fixed Costs Versus Variable Charges
One of the most misunderstood aspects of a residential water bill is the fixed-cost component. Many utilities charge a base service fee simply for maintaining the connection, regardless of usage. This fee can range from a few dollars to more than twenty dollars per month depending on the municipality. For low-consumption households — such as a single-person home or a recently vacated rental — this means the bill will never reach zero even if water use is minimal. Variable charges, by contrast, respond directly to consumption. They are where household size and behavior have the most influence. A household with two adults and two children will consume water differently than a retired couple, even in the same home. The variable portion of the bill reflects those differences, but only once consumption crosses the first tier threshold. Understanding which part of a bill is fixed and which part is controllable is the starting point for any meaningful cost management.
National Averages and Why They Mislead More Than They Inform
The frequently cited national average for a monthly residential water bill in the United States falls somewhere between forty and seventy dollars. That range is technically accurate as a statistical midpoint, but it masks the degree of variation that exists across income levels, household sizes, climate zones, and utility pricing models. A household in Phoenix paying for outdoor irrigation in summer will see bills that bear no resemblance to a two-person apartment in the Northeast with no lawn and a low-flow showerhead.
According to data published by the U.S. Environmental Protection Agency, the average American family uses more than 300 gallons of water per day at home, with a significant portion attributed to leaks, irrigation, and inefficient fixtures. That consumption figure, when multiplied across tiered pricing structures, produces widely different billing outcomes depending on local utility rates.
How Household Size Shapes Monthly Costs
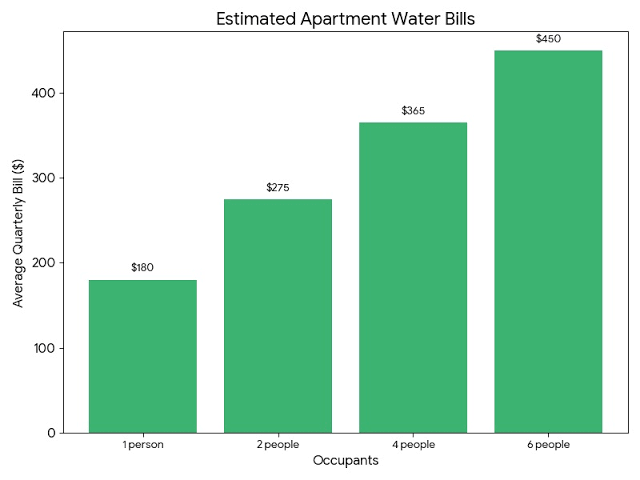
Household size is one of the most reliable predictors of water consumption and, by extension, monthly billing. A single-person household typically uses between 50 and 80 gallons per day, while a family of four can use upward of 300 gallons depending on habits, appliances, and outdoor use. This difference does not scale linearly on the bill, however, because of how tiered pricing works. A single occupant often stays within the lowest tier and pays the base rate per gallon throughout the month. A larger household may cross into higher tiers where each additional gallon costs more than the last.
This pricing mechanic means that a family of four does not simply pay four times what a single occupant pays. Depending on the local utility’s tier structure, the multiplier can be considerably higher. This is particularly relevant for landlords setting utility-inclusive rents or property managers estimating operating costs for multi-bedroom units.
Regional Pricing Structures Carry More Weight Than Usage Alone
Two households with identical consumption patterns and identical family sizes can receive dramatically different monthly bills based solely on where they live. Cities in the western United States, particularly those managing long-term drought conditions, often charge more per gallon as a conservation mechanism. Cities in the Great Lakes region, where freshwater is abundant, may charge considerably less for the same volume of use.
Infrastructure age also plays a role. Municipalities with aging water systems have passed increased maintenance and replacement costs onto residential customers through higher base rates and infrastructure surcharges. This means a household in an older East Coast city may pay more per gallon than a household in a newer Sun Belt suburb, regardless of consumption levels. The local utility’s financial condition, capital investment schedule, and rate approval process all influence what shows up on a residential bill.
The Role of Seasonal Use in Annual Bill Variability
For households with any outdoor water use — lawn irrigation, garden watering, car washing, or filling a pool — the difference between a winter bill and a summer bill can be substantial. In some regions, outdoor water use accounts for more than half of total annual household consumption. When this use coincides with tiered pricing thresholds, even moderate outdoor watering can push a household into a higher billing tier for several consecutive months.
This seasonal volatility is rarely anticipated by households budgeting on a fixed monthly basis. Annual water cost projections that use only a mid-year average bill will underestimate the summer peak and overestimate the winter low. For landlords and property managers, this variability creates a planning challenge when utility costs are included in lease agreements or operating budgets.
Water Bill Benchmarking Across Property Types
Residential water bills are most meaningful when compared against properties with similar characteristics. A three-bedroom single-family home with a lawn should be benchmarked against other three-bedroom homes in the same utility zone, not against a national average that includes apartment units, townhomes, and homes without outdoor irrigation. Similarly, a newly constructed home with modern low-flow fixtures will consume less water per occupant than an older home with outdated plumbing, all else being equal.
For landlords evaluating whether a property’s water costs are within a normal range, or for homeowners trying to determine whether a recent bill spike reflects a leak or a rate increase, comparison against a relevant benchmark is more useful than a national figure. This is also where a water bill calculator becomes a practical tool rather than a general reference — it allows for input of actual consumption data against local rate structures to produce a meaningful comparison.
What Persistent Bill Increases Usually Indicate
A water bill that rises steadily over several billing cycles, without a corresponding increase in household size or outdoor use, typically points to one of a small number of causes. Silent toilet leaks are among the most common and most expensive — a flapper valve that fails to seal completely can waste several thousand gallons per month without producing any visible sign of a problem. Running irrigation systems with cracked lines or misaligned heads can produce similar losses outdoors.
Rate increases imposed by local utilities are another factor. Unlike electricity rates, which receive broader public attention, water rate adjustments often pass with limited awareness among residential customers. Reviewing the utility’s published rate schedule and comparing it against the previous year’s schedule is a straightforward way to separate cost increases driven by usage from those driven by rate changes.
- A silent toilet leak can waste between 200 and 400 gallons of water per day, making it one of the highest-impact but least visible contributors to an unexplained bill increase.
- Utility rate adjustments often take effect at the start of a fiscal year and are reflected in bills without a direct notification to customers, requiring homeowners to cross-reference rate schedules independently.
- Households that add water-intensive appliances — such as an in-home water softener, a second refrigerator with an ice maker, or a spa — frequently experience consumption increases that cross into a higher billing tier without realizing it until the bill arrives.
- Seasonal irrigation systems that are not properly shut down or calibrated after installation can run on schedules that no longer match current landscaping needs, running longer than necessary and adding consumption costs that compound over several months.
Concluding Observations
The average American water bill in 2025 is less a single number and more a function of overlapping variables — household size, local utility pricing, infrastructure costs, seasonal behavior, and fixture efficiency all contribute to what appears on the monthly statement. For most households, the bill arrives and gets paid without analysis. But for those managing costs across multiple properties, planning an annual budget, or trying to understand an unexplained increase, the details behind the total matter considerably.
National averages offer a point of orientation, but they rarely reflect the conditions of any individual household accurately. A more useful approach is to build a working understanding of how local utility pricing is structured, what portion of monthly costs are fixed versus variable, and how household-specific consumption patterns interact with tiered billing. That level of understanding does not require specialized knowledge — it requires only that the components of a water bill be examined with some consistency rather than treated as an unavoidable fixed expense.
Water costs are likely to continue rising across most U.S. regions as utilities manage aging infrastructure and shifting water availability. Households and property managers who develop a clear picture of their current baseline will be better positioned to respond to those increases with specific, proportionate actions rather than general cost-cutting measures that may not address the actual driver of higher bills.